Using Gamma to Make Better Decisions Trading Short-Dated Options
I’ve been trading short-dated options on the SPX (mostly 0 and 1-DTE iron condors). It’s very easy for this strategy to look like it’s working. If you manage your sizing, pick reasonable entries, and manage risk aggressively, it often feels like it can’t lose. It’s possible to win 90–95% of the time. But the remaining 5–10% when the trade does not work can be catastrophic. When things go wrong, they can go very wrong.
For short-vol strategies like iron condors, it takes an extreme move for a trade to really hurt you. And often, those extreme moves show up around unexpected events: geopolitical headlines, macro shocks, or any sudden changes in perceived risk.
I learned this the hard way with Mr. Trump playing the markets like a boy spinning a yoyo. Back in October, markets already seemed to be in a fragile place when headlines hit around potential 100% tariffs on China tied to rare-earths export restrictions. The market sold off, then just as quickly reversed into a late-October rally heading into the FOMC meeting. I was whipsawed between those two extreme moves.
Of course, while the headlines precipitated the downward move, they did not create the conditions that allowed it. Even before the headlines, the options market already had a particular structure: concentrations of gamma, fragile zones, and asymmetric hedging pressure. The news simply acted as a catalyst, determining how that structure expressed itself in price. But back in October I was totally unaware of the underlying market structure and so it was easy to get frustrated by unexpected events.
The Limits of Delta
When I first learned this trade, I was given a simple playbook for managing risk:
- Avoid binary events
- Keep position sizing small relative to portfolio
- Position short legs based on delta
Delta is commonly used as an estimate for the probability of an option expiring in the money. So if you short a call with a 5 delta, you might think you have a 95% chance of success.
But unlike roulette, where probabilities are static, delta is not a static value. It changes as the market moves. A short call with a 5 delta today might not be a 5 delta tomorrow when volatility picks up or price moves quickly. So the simple playbook I was given becomes:
- Keep short strikes at low delta
- Watch delta as price moves
- Adjust or exit when delta crosses certain thresholds
And most of the time this works until it doesn’t. What I found unsatisfying about this approach was that adjustments made “because delta increased” often did not improve my position. After sharp moves, I frequently adjusted only to have the market reverse and bounce back like October. I also noticed that a 5 delta option on one day felt very different from a 5 delta option on another.
As both an engineer and a philosopher, these observations and experiences raised the deeper question, “If delta isn’t stable, what controls how and when it changes?”
Gamma as a Structural Lens
Market behavior is shaped by many interacting forces, including dealer and market-maker hedging, event-driven catalysts, and shifts in volatility.
Without a sense of what’s driving the market structurally at a given moment, it’s hard to know how to manage a position. Should you exit entirely? Adjust? Or sit tight?
I wanted a more principled way to understand how to answer these questions. What was driving my losses when trades failed? What was mechanically supporting my wins when trades worked? These questions pushed me to look beyond delta and start paying attention to the broader options landscape: open interest, volume, volatility, and, most importantly, gamma.
Gamma is the second-order derivative of delta. Delta is the rate of change of an option price relative to changes in the underlying price. Gamma is the rate of change of delta relative to changes in the underlying price. So, if delta is velocity, gamma is acceleration.
Specifically, I found that others were looking at gamma exposure (GEX). GEX at a given strike measures how sensitive the aggregate option position is to changes in the underlying price. If one assumes that dealers and market makers are actively hedging option risk, then areas with higher GEX can indirectly point to price levels where hedge adjustments may be faster and larger.
I compute GEX as a function of gamma, open interest, the current underlying price (spot), and the contract multiplier: \(\text{GEX} = \gamma \times \text{open interest} \times \text{spot}^2 \times \text{contract multiplier}\) In some views, I treat this as “unsigned” (gross gamma) to reason about overall system stability. In others, I apply a simple sign convention (calls positive, puts negative) to reason about potential directional hedging pressure.
This measure did not help me predict price or tell me directly how and when to trade, but it did provide a window into the structure of the market. I could see:
- Where gamma is concentrated
- Who is likely on the other side of that exposure
- How dealer hedging flows might reinforce or dampen price movement
Based on this, I started building a small set of diagnostic charts to help me reason about market structure:
GEX by Price
Shows how net gamma exposure would evolve across a range of hypothetical prices, highlighting where hedging behavior is likely to flip as spot moves. 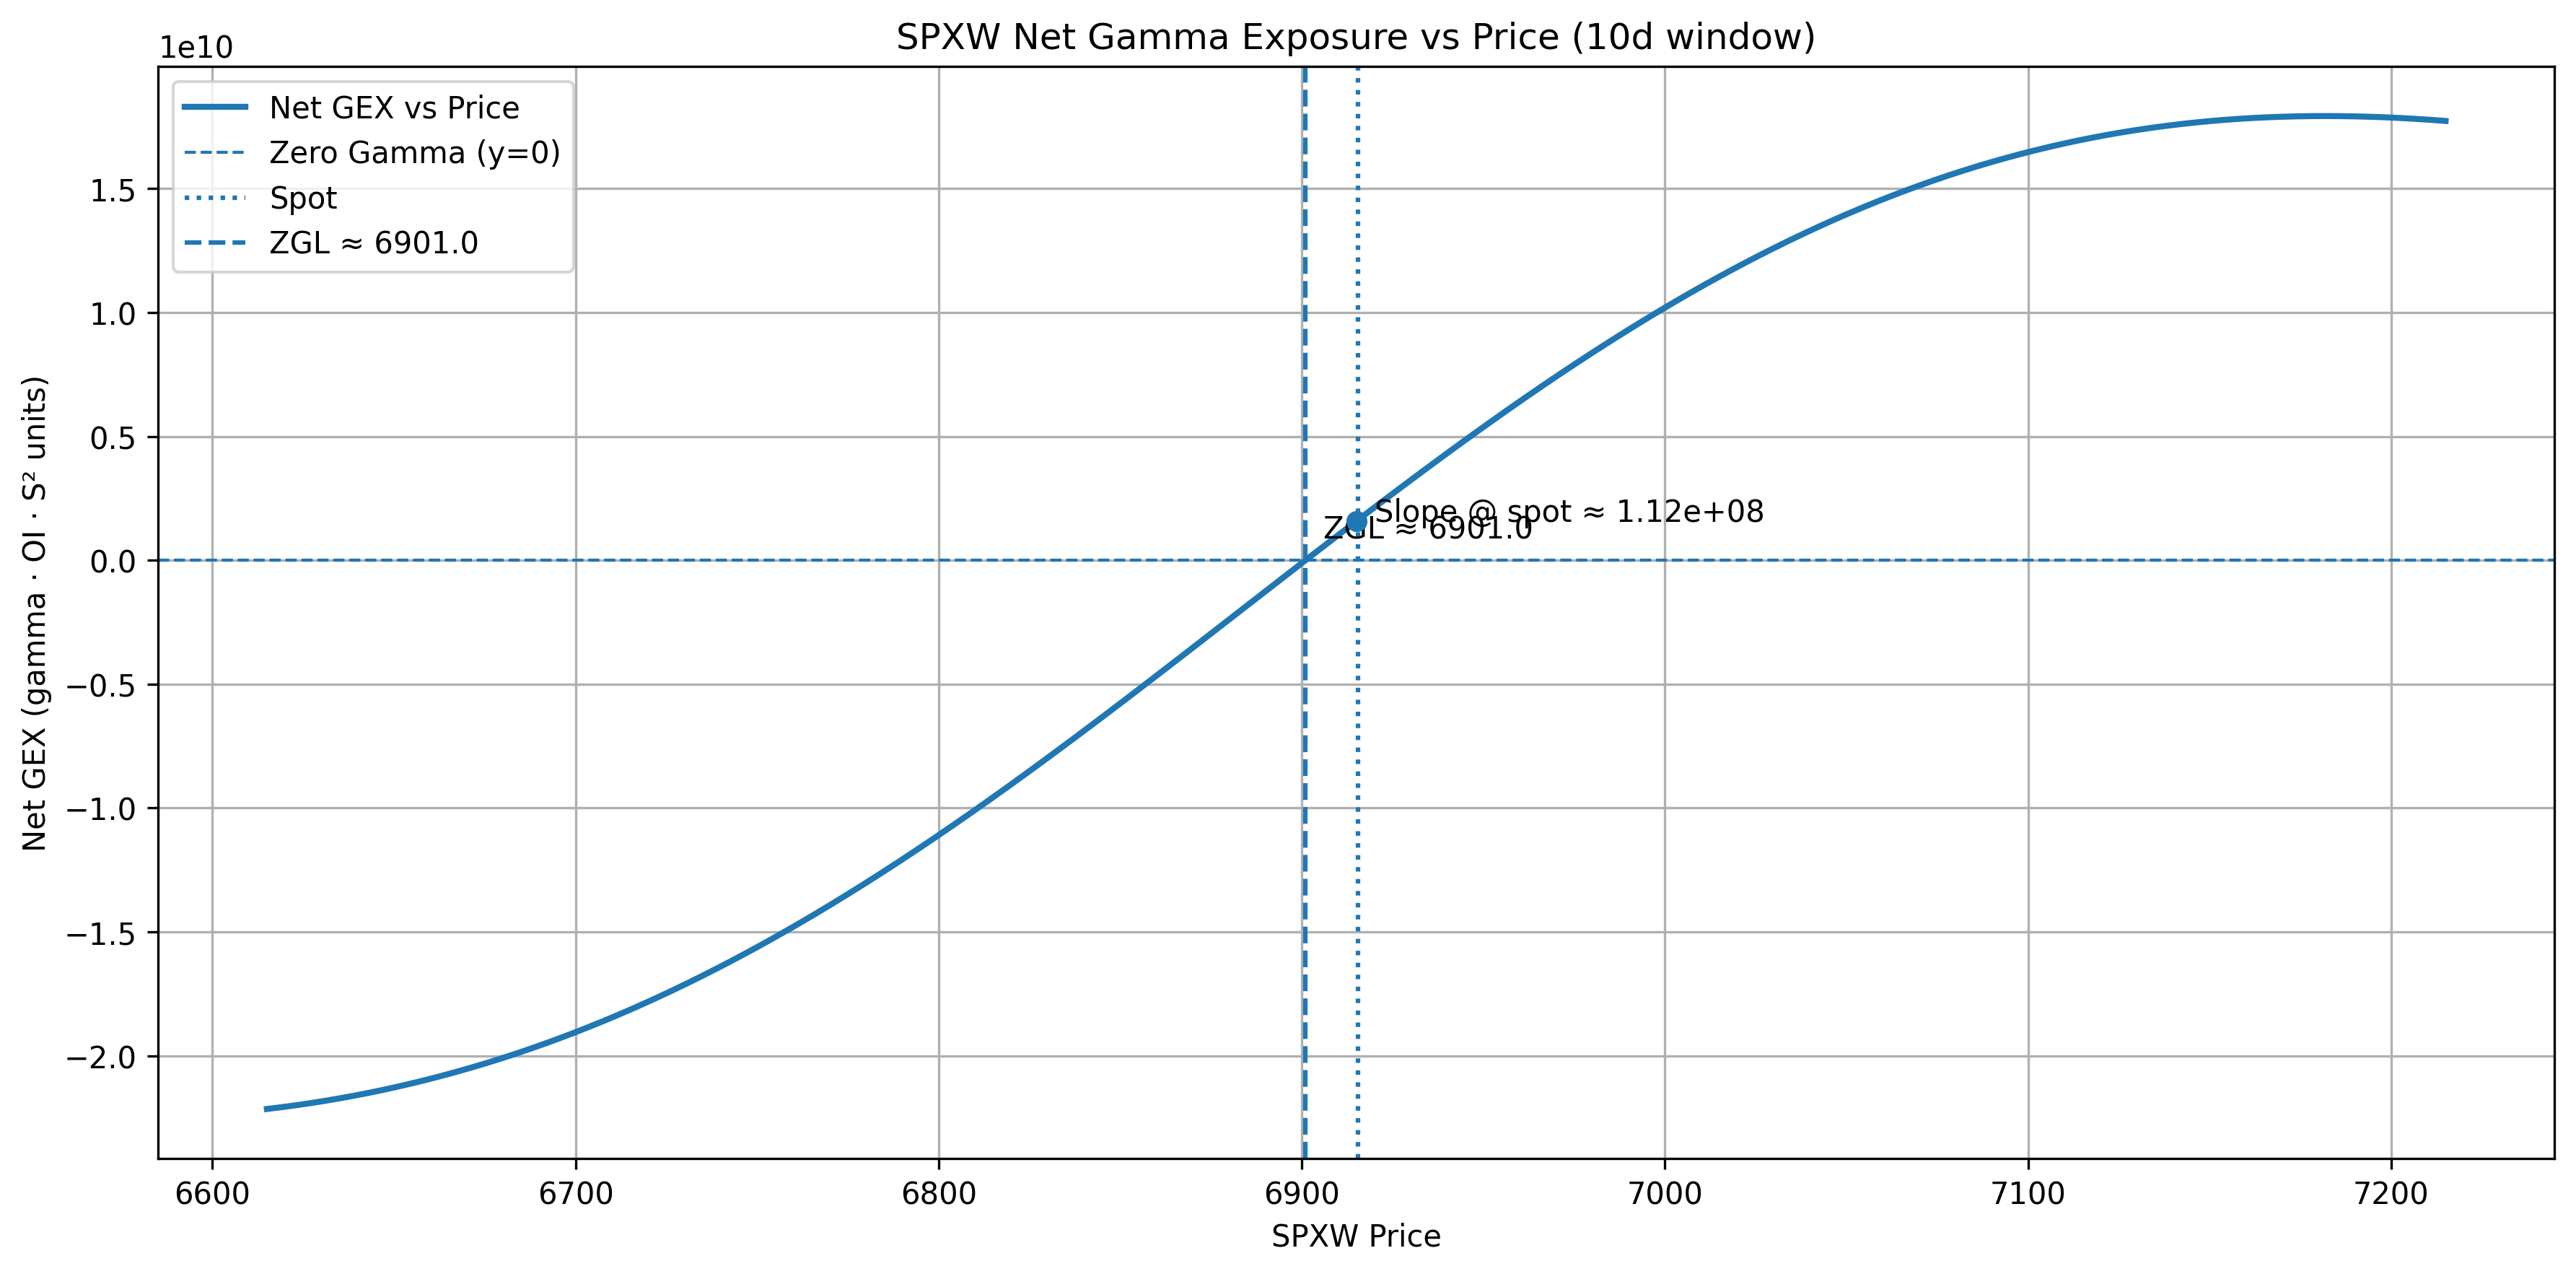
GEX by Strike (per expiry)
Aggregates gamma exposure by strike over multiple calendar days revealing where dealer hedging activity is most concentrated. This helps me identify potential pinning zones versus unstable regions. 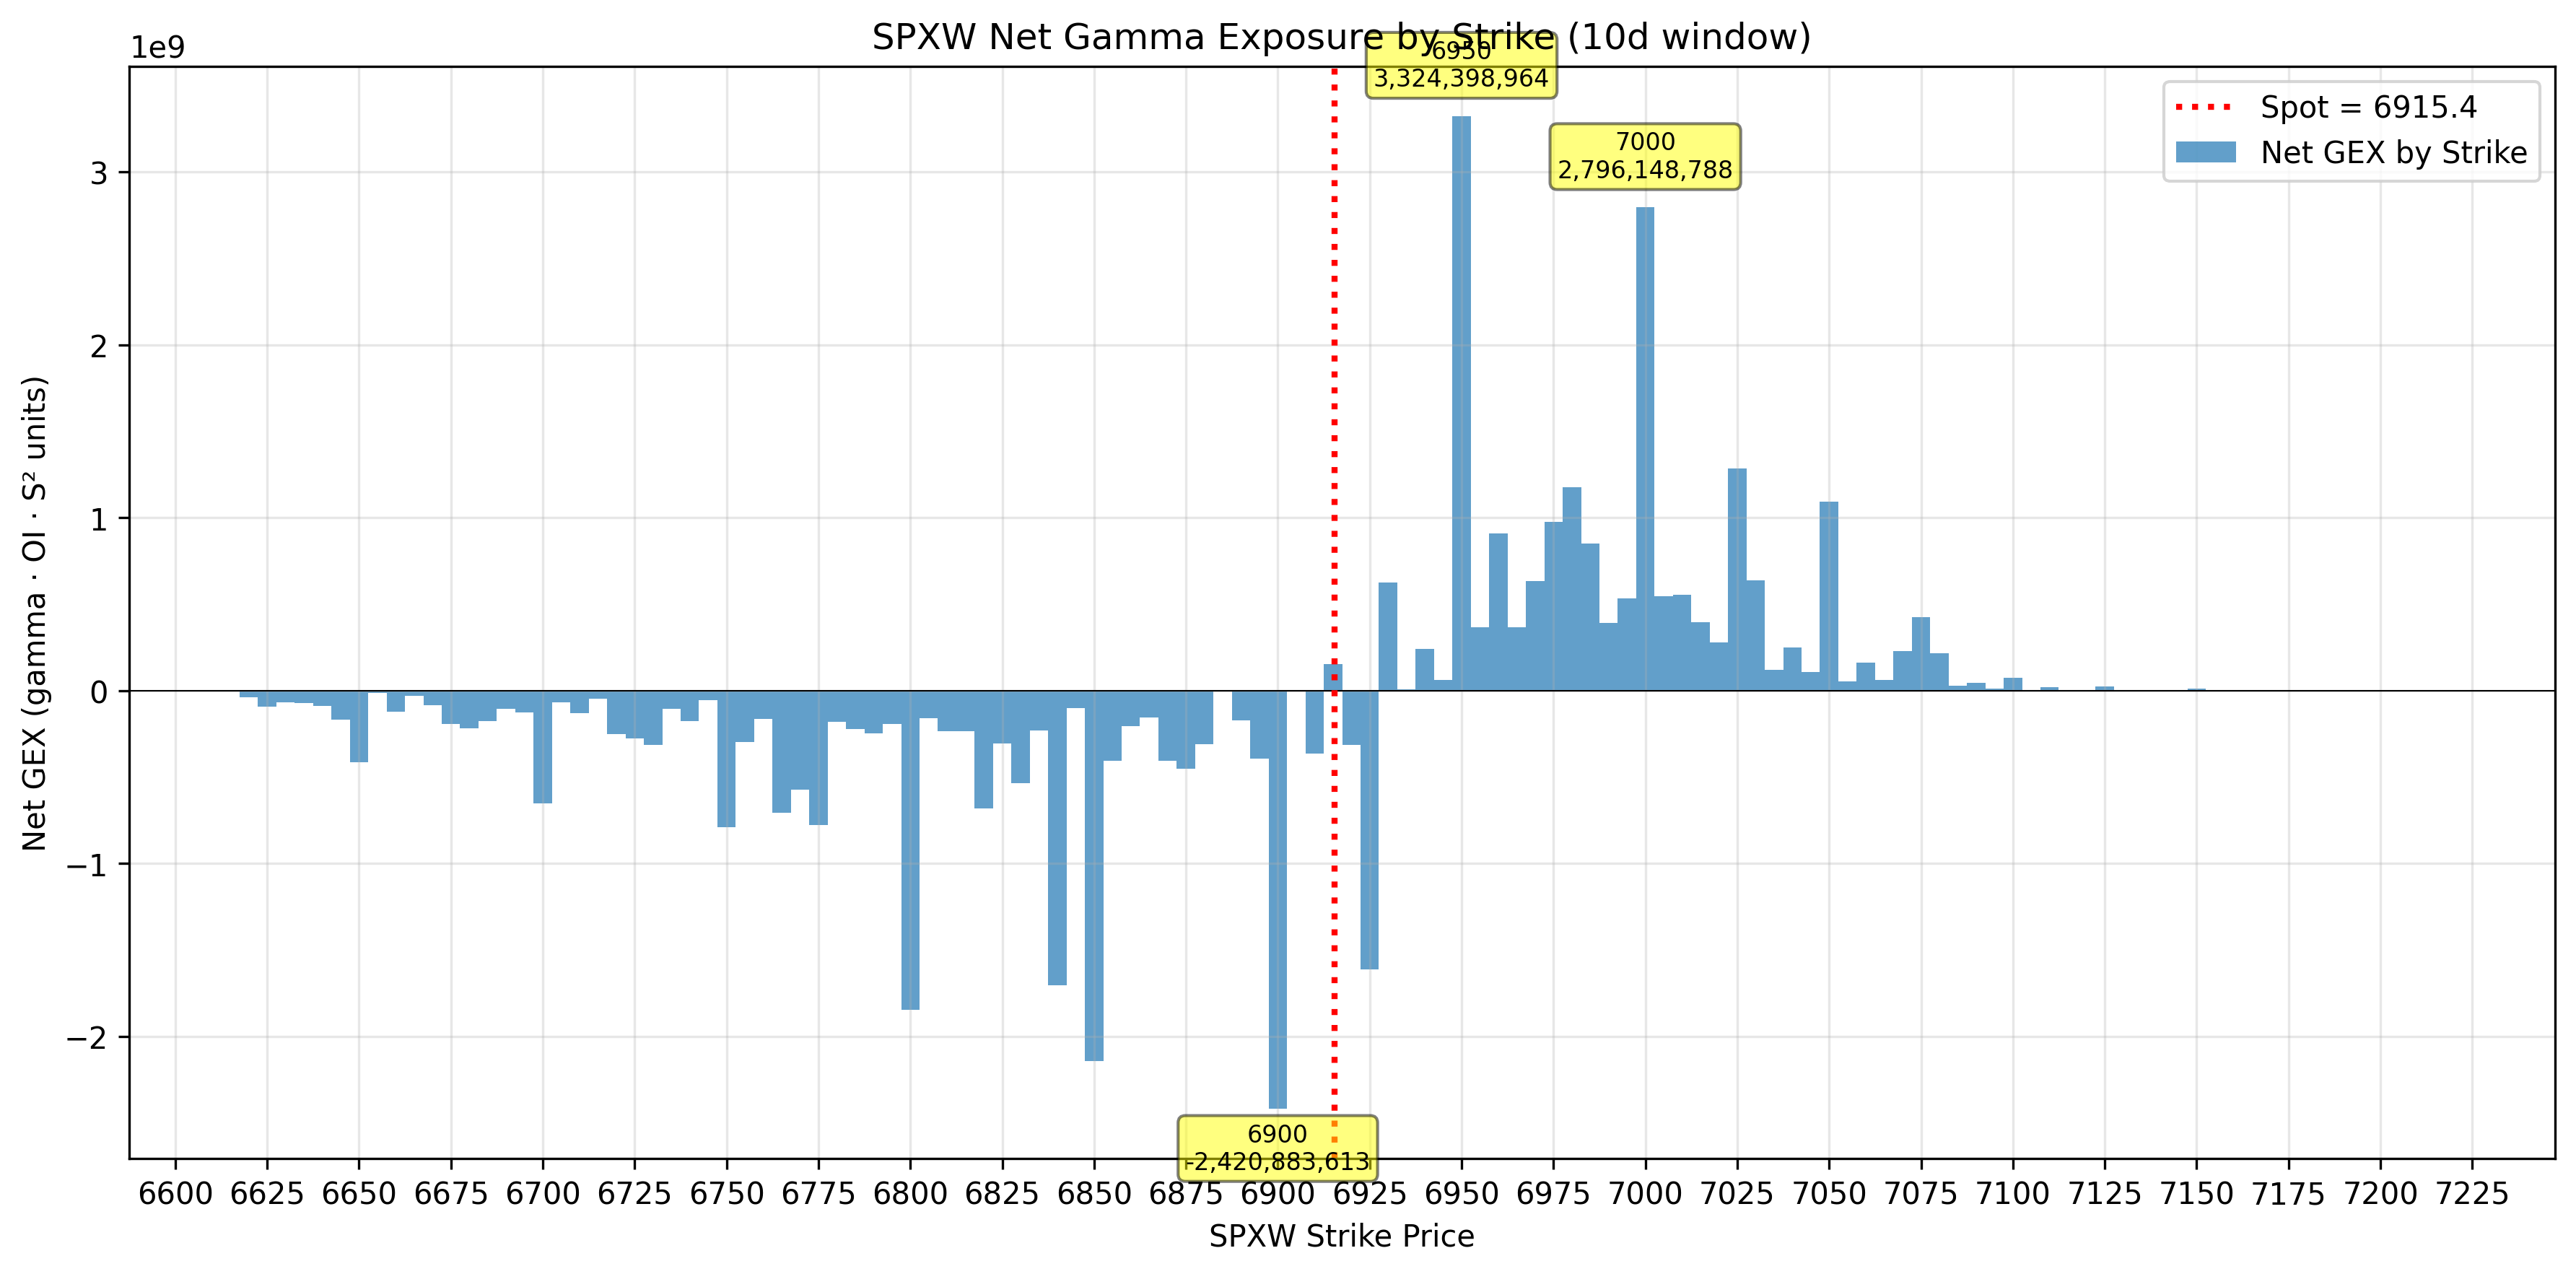
Directional Gamma Imbalance (DGI)
Compares gamma mass above versus below spot within a defined window, producing a normalized measure of whether hedging pressure is asymmetric to the upside or downside. 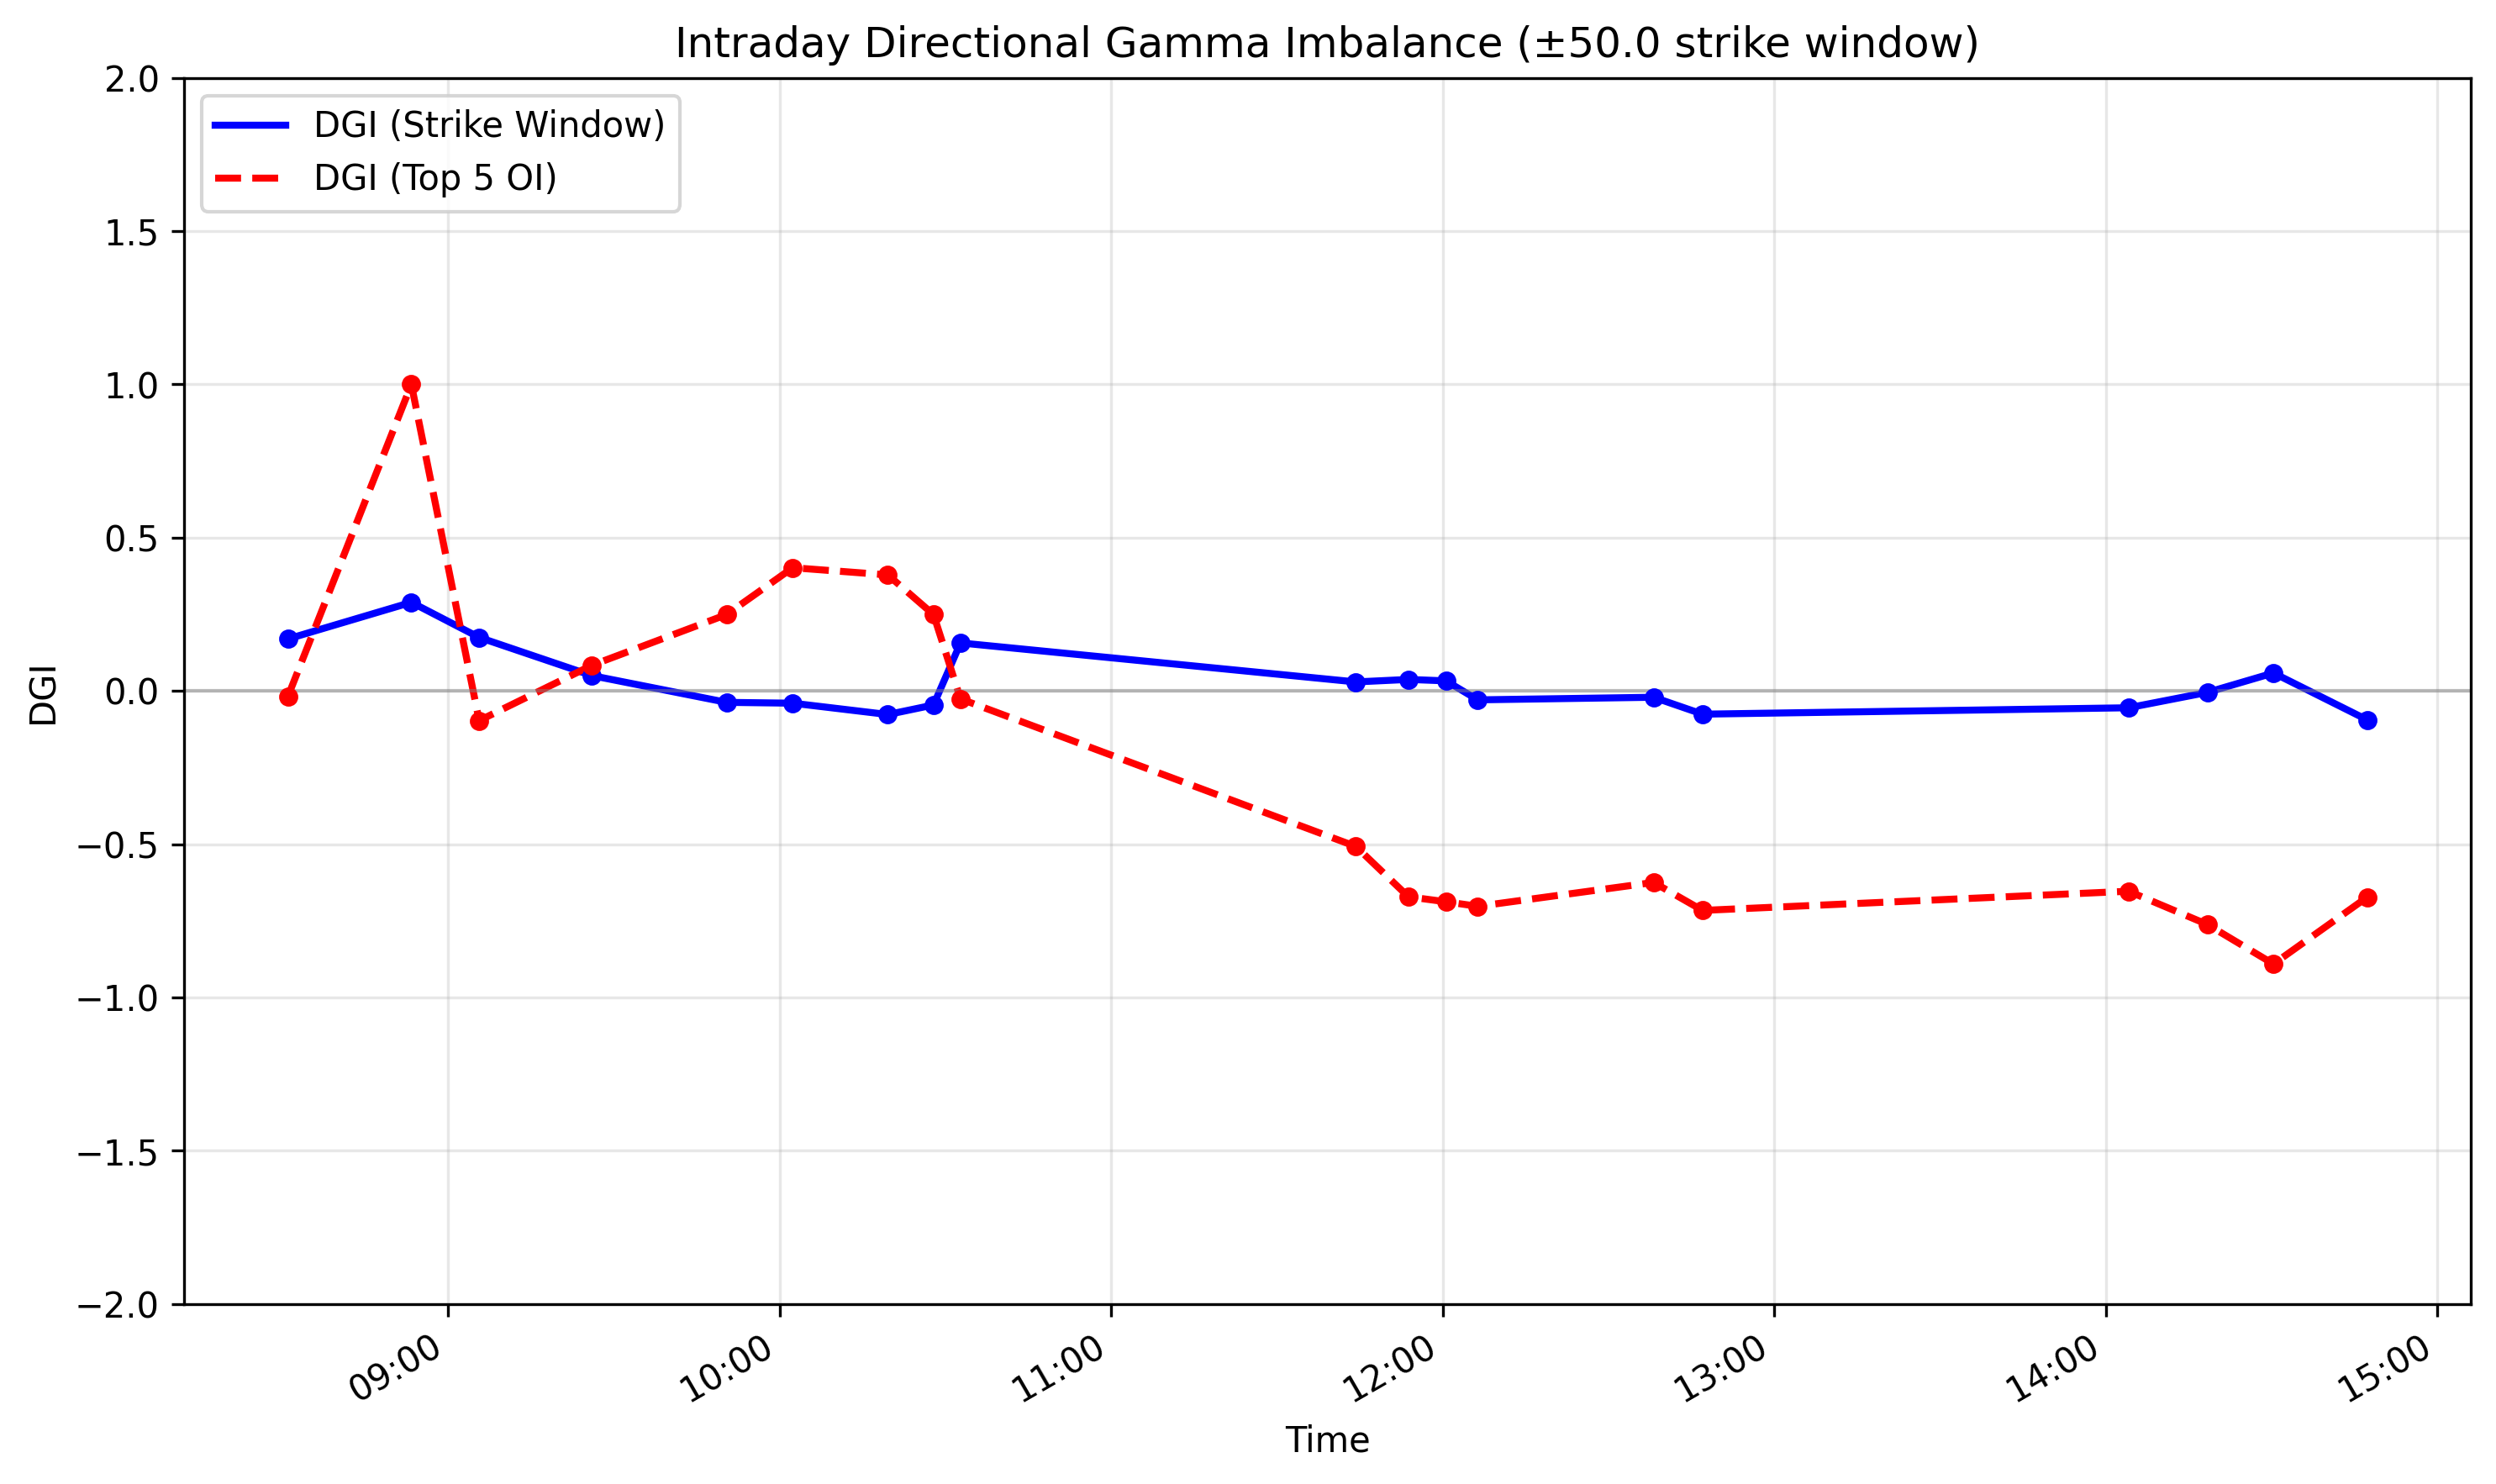
Gross Gamma Exposure (GGE)
Tracks the total amount of nearby gamma in the system, offering a coarse but useful signal for distinguishing between mean-reverting and breakout-prone regimes. 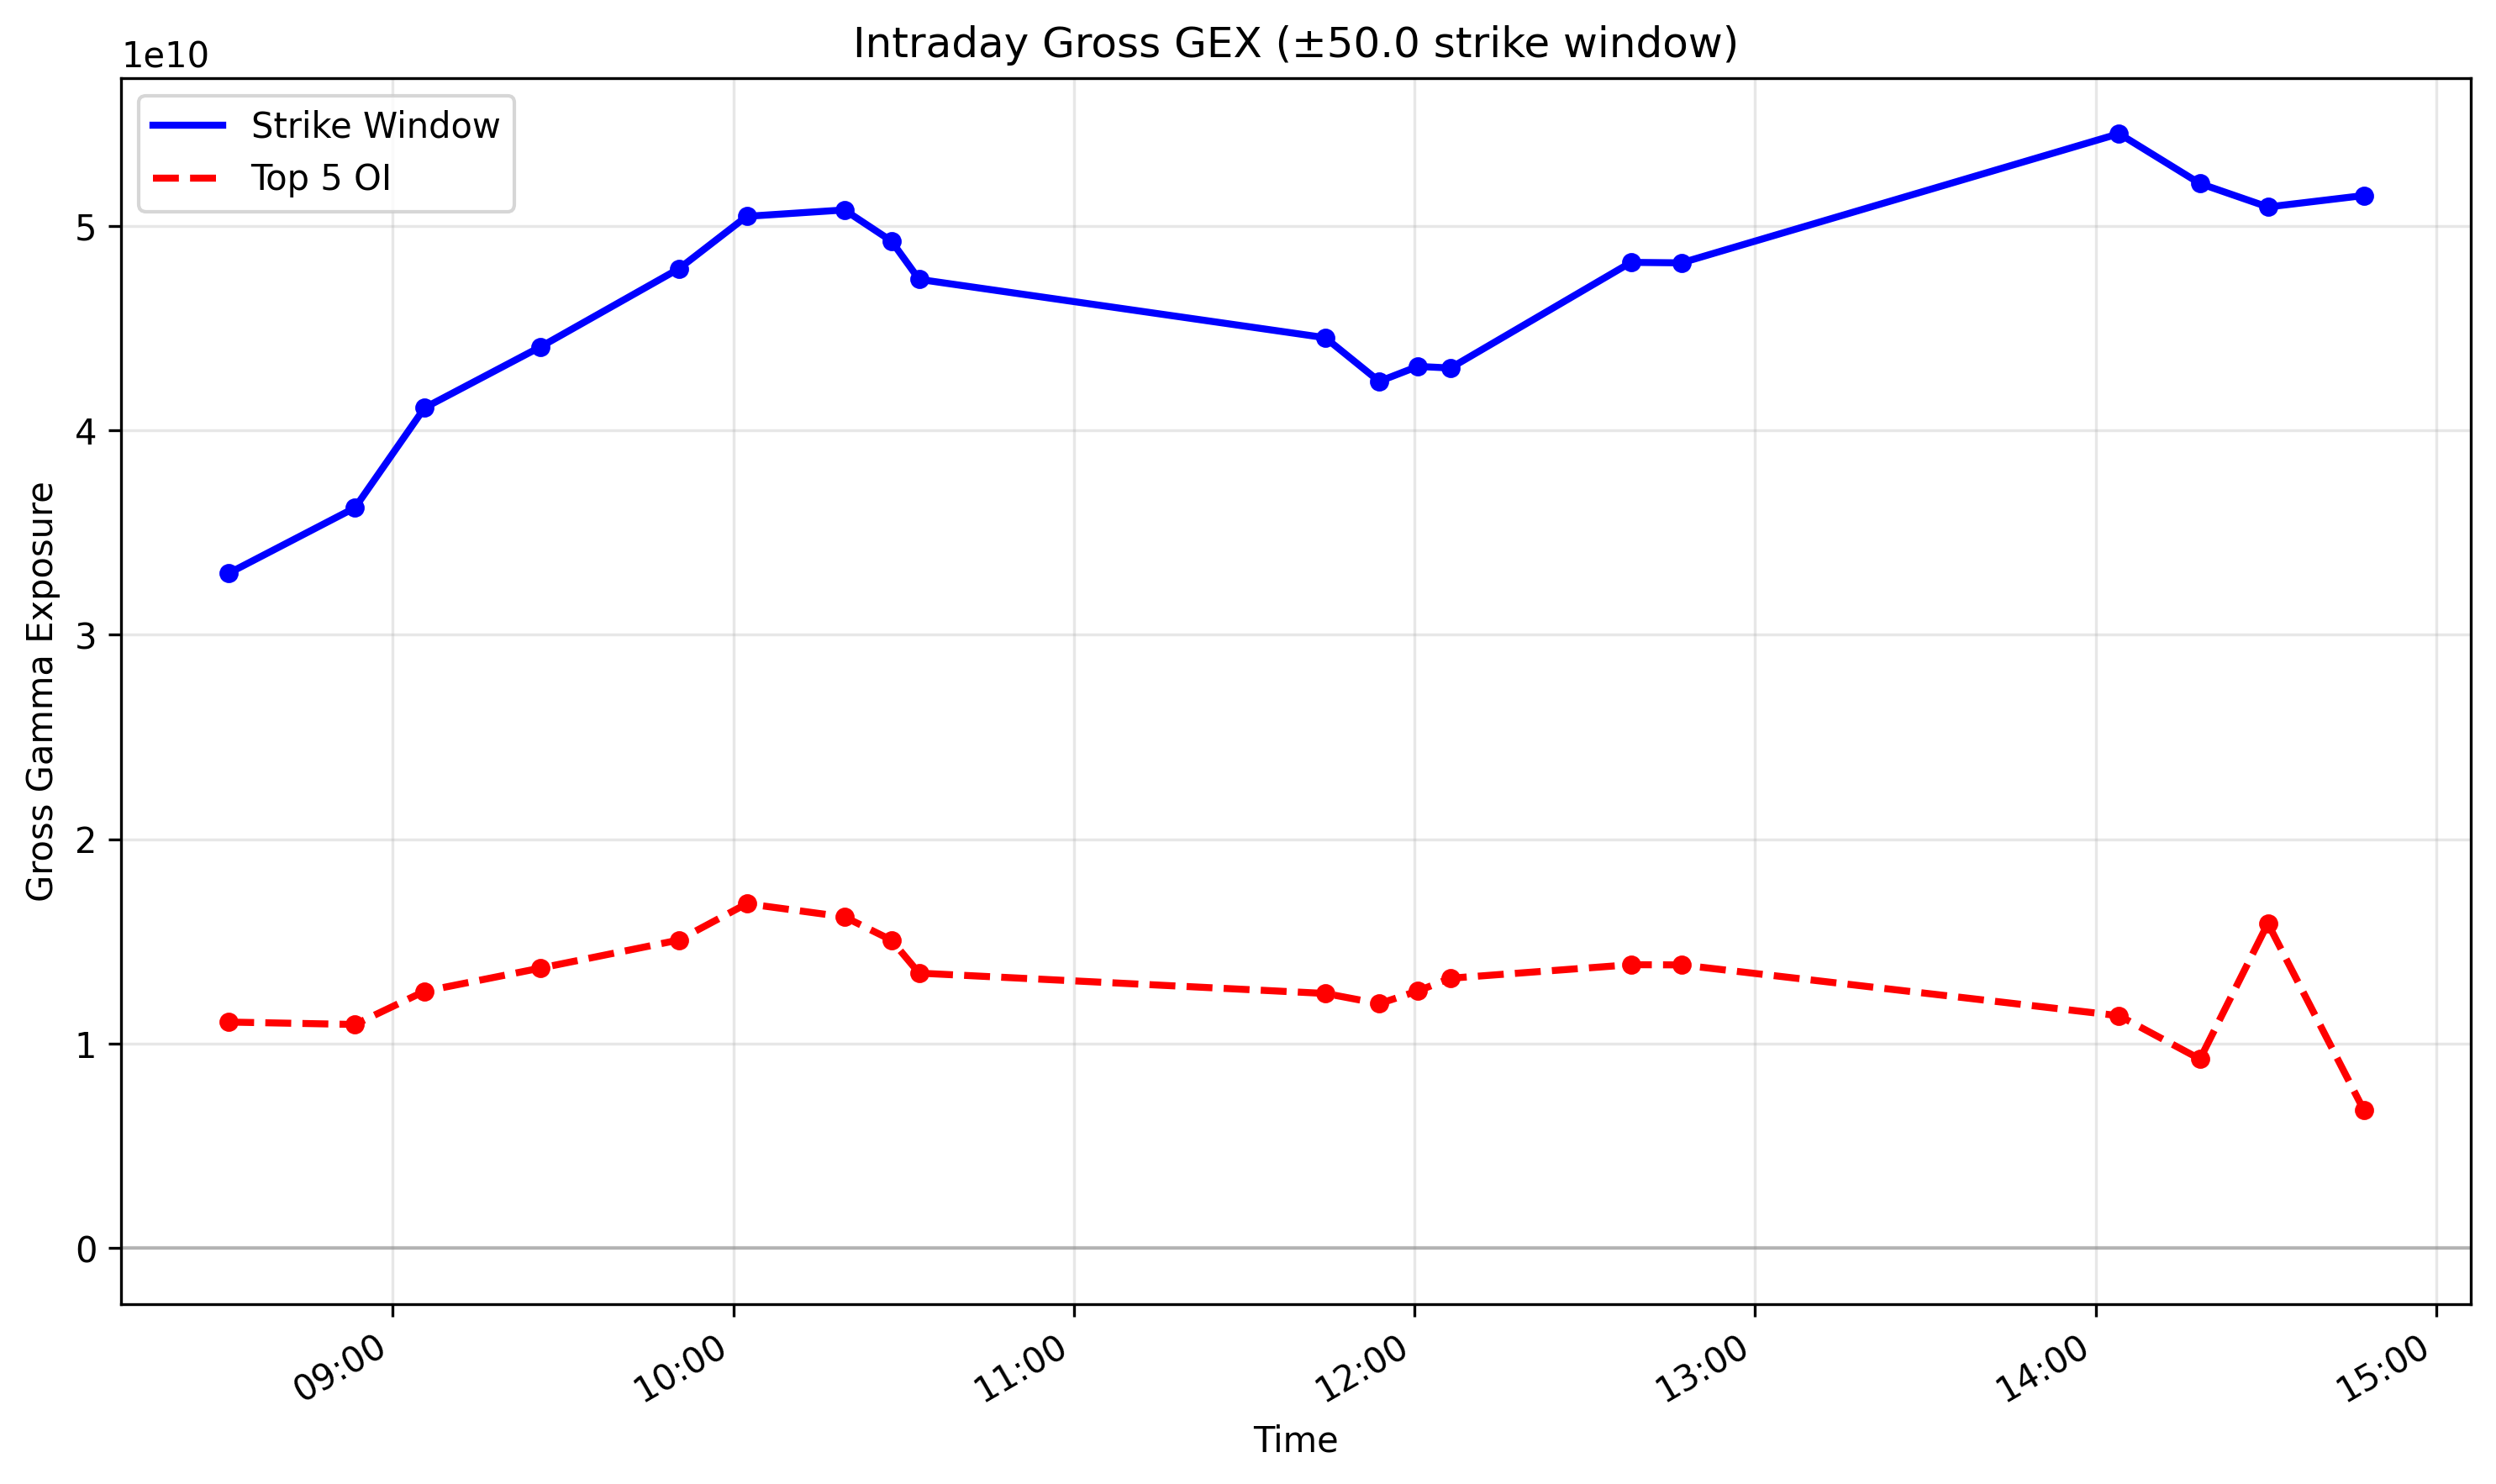
I’m not claiming originality here. Variations of these charts exist all around. What mattered for me was having a coherent structural framework to interpret them.
What Changed for Me
Using these diagnostics didn’t magically increase my win rate beyond 90–95%. What did change was my decision quality.
I’m better at distinguishing between:
- situations where the original trade thesis was still defensible and
- situations where market structure had shifted enough that the thesis no longer applies
Instead of reacting mechanically to delta moves, I now try to reason about why the market is behaving the way it is and whether existing structure suggests hedging flows are likely to stabilize price or accelerate risk.
Just this week Trump again injected uncertainty into the market. This time by threatening tariffs on Europe in the context of Greenland. As before, the market moved quickly. But again, the headlines didn’t arrive in a vacuum. The options market already had a structure that made it vulnerable to sharp moves; the news was just a trigger.
Because I had a clearer view of that structure, my response wasn’t improvised. It followed directly from the same framework:
- I exited the call side early while it was still cheap.
- I rolled the put side down and out, giving the market room to stabilize.
- I used GEX by strike to reposition risk toward areas where hedging sensitivity appeared lower.
- I monitored directional gamma imbalance to see whether upside vs downside hedging pressure was becoming more balanced as the news settled.
- I watched gross gamma exposure across nearby expiries to assess whether overall gamma was rebuilding, suggesting a shift back toward a more stabilizing regime.
Throughout the week, I watched how gamma evolve to see whether the structure that justified those changes persisted as the situation de-escalated.
This wasn’t about predicting headlines. It was about adjusting when an external shock disrupted the existing structure, and then monitoring whether that structure stabilized or fundamentally changed.
Open Questions
Paying attention to the GEX has helped me manage risk more deliberately, but I’m under no illusion that it’s the full story. In particular, I’m focused on trying to answer when gamma structure meaningfully shapes price behavior versus situations where it matters a lot less. For example, across different volatility and market regimes.
I’m also curious how this framework extends beyond very short-dated trades. How useful are these gamma-based diagnostics for 0–1 DTE positions compared to longer-dated strategies, such as 30 DTE?