Multi-Sleeve Statistical Arbitrage in U.S. Equities
Lots of statistical arbitrage research focuses on finding a strong signal. My research ended up pointing towards another conclusion. Diversification across economically distinct alpha signals matters more than maximizing the standalone Sharpe of any one signal.
I built a diversified statistical arbitrage portfolio using S&P 500 equities combining momentum, active-return mean reversion, residual mean reversion, distance-pairs relative value, sector relative mean reversion, and event driven gap reversion into a dollar neutral long short framework. I use regime gating, risk scaling, and iterative portfolio construction to combine sleeves with low correlation into a diversified portfolio robust across weighting schemes and ablation tests.
The final portfolio achieves an in sample net Sharpe ratio above 2.0 after 10 basis points of transaction costs during the in-sample 2015–2023 period. During the out-of-sample period (2024–2026), performance weakens, but remains profitable while preserving much of the portfolio’s diversification structure.
Diversification matters more than standalone Sharpe
The strongest standalone signals after conditioning are active-return mean reversion and residual mean reversion. But these sleeves also form a correlated cluster because they are all expressions of the same underlying cross sectional reversal phenomenon (the reddish section in the below return correlations matrix). Residualization and sector anchoring change the implementation characteristics and regime behavior, but the core bet remains similar: stocks that moved too much recently should revert.
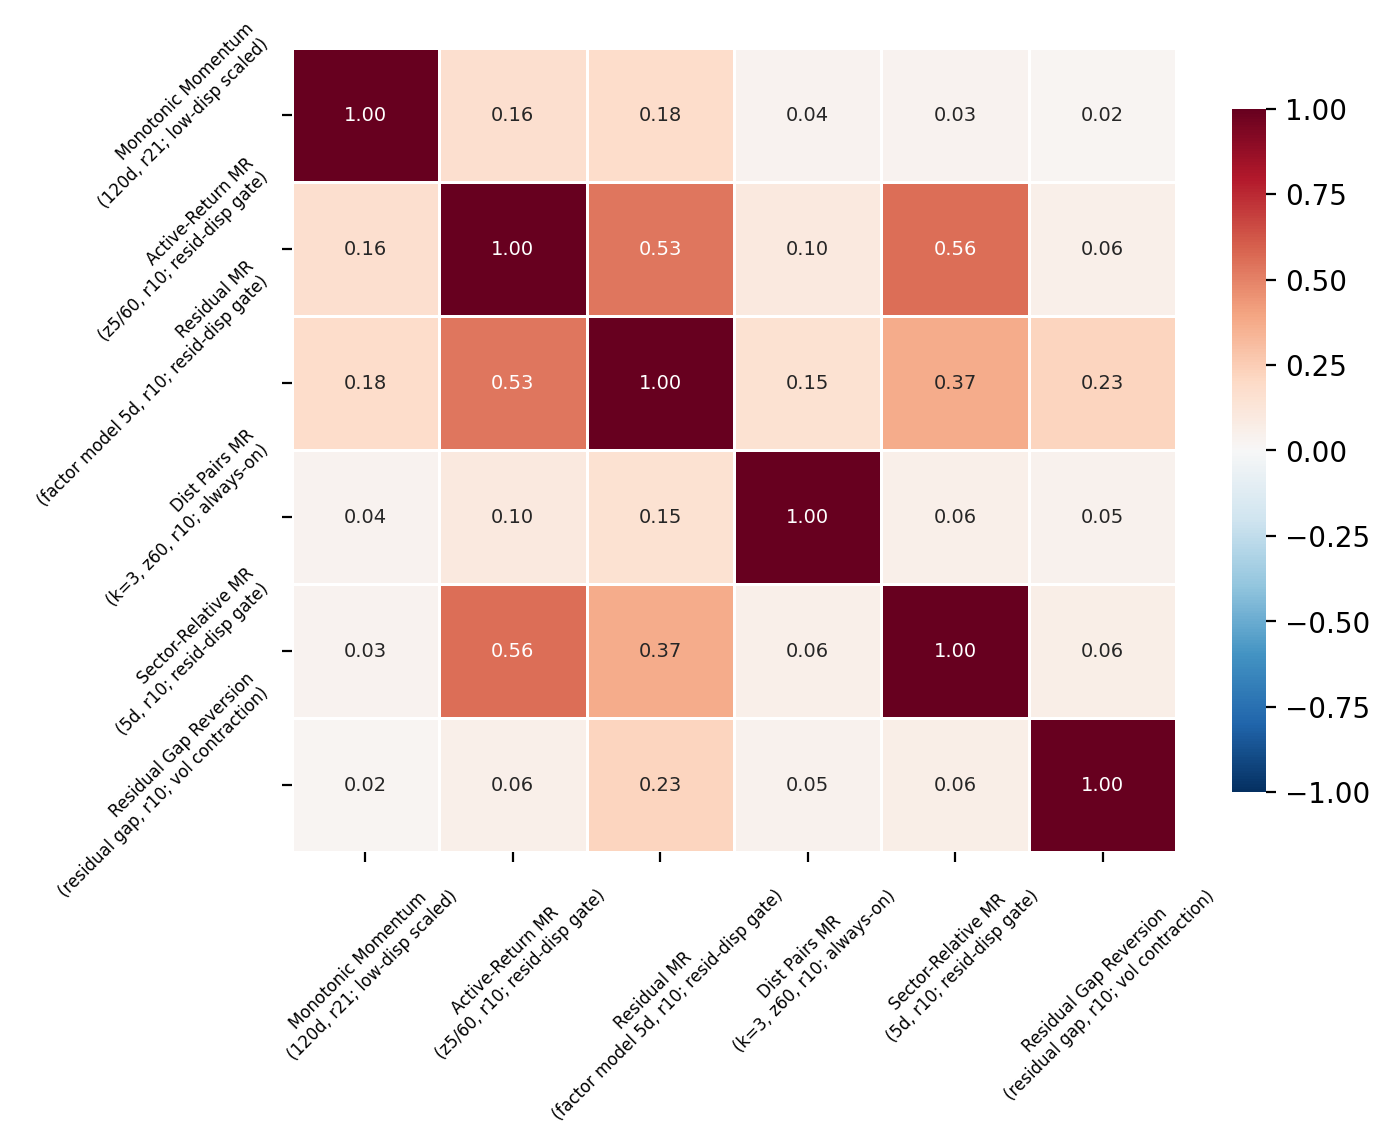
However, many of the signal families I tested, in fact, have low correlation (see the heatmap). Low correlation matters because independently profitable sleeves can smooth portfolio returns even when individual signals temporarily weaken. The portfolio becomes more interesting once I start adding these signals as new sleeves rather than focusing on maximizing standalone signal Sharpe.
Specifically, distance-pairs mean reversion stands apart from the broader mean reversion cluster. Its correlations to every other family stay around 0.04 to 0.15. So even though DPMR is also a form of mean reversion, it defines reversion differently. It trades convergence toward a stock’s nearest historical peers rather than reversal toward a cross-sectional or factor-adjusted mean. That distinction produces a return stream that behaves more like a distinct alpha source.
Momentum and event driven gap reversion also remain fairly independent from the broader mean reversion cluster. Monotonic momentum correlates only 0.16 to 0.18 with the MR families while event driven gap reversion captures short horizon idiosyncratic dislocations on a distinct timescale.
The key result here is that no pair of families exhibits dangerously high correlation. The diversification benefit appear structural rather than dependent on any single dominant signal.
Distance pairs are the portfolio core
The portfolio buildout starts with the strongest conditioned mean reversion sleeves, but diversification really starts once the distance-pairs (DPMR) sleeves are added. Combining the two strongest MR sleeves improves Sharpe from 1.07 to 1.24, but because they share moderate correlation the combination doesn’t dramatically reduce drawdown. Adding the first DPMR sleeve pushes Sharpe from 1.24 to 1.56 while max drawdown also drops from −6.0% to −3.8%.
| Sleeve Added | Sleeves | Net SR | Gross SR | Turnover | Max DD |
|---|---|---|---|---|---|
| Residual MR (high resid. disp. gate) | 1 | 1.074 | 1.181 | 1.542% | −4.526% |
| + Active-Return MR (breadth gate) | 2 | 1.242 | 1.339 | 1.655% | −6.020% |
| + DPMR (z20, vol contraction gate) | 3 | 1.556 | 1.746 | 2.447% | −3.753% |
| + DPMR (z60, vol expansion gate) | 4 | 1.720 | 2.031 | 3.799% | −3.105% |
| + DPMR (z60, always-on) | 5 | 1.786 | 2.219 | 5.536% | −3.254% |
| + DPMR (z10, panic gate) | 6 | 1.883 | 2.297 | 4.699% | −2.811% |
| + Monotonic Momentum (crash-gated) | 7 | 1.989 | 2.417 | 4.619% | −3.196% |
| + Resid. Gap Reversion (breadth-gated) | 8 | 2.039 | 2.548 | 5.020% | −2.347% |
Additional DPMR variants continued adding incremental value even though they belong to the same signal family. All four DPMR sleeves shared the same base construction. These signals trade relative value convergence among historically similar stocks. For each stock, I identify k nearest partners using a correlation based distance metric on normalized log price paths. The quantity $d_{i,t}$ measures the current deviation between a stock and its partner basket while $\bar{d_{i,t}}^{(w)}$ and $\sigma^{(w)}(d_{i,t})$ normalize that deviation relative to its recent history. The resulting $z_{i,t}$ measures how far the stock has diverged from its peers. The trading signal then fades extreme deviations by clipping the z score into the range [-2,2]:
\[z_{i,t} = \frac{d_{i,t} - \bar{d}^{(w)}_{i,t}}{\sigma^{(w)}(d_{i,t})}\] \[s^{\text{pairs}}_{i,t} = -\operatorname{clip}(z_{i,t}, -2, 2)\]However, the DPMR conditioning filters partition the alpha engine across different market environments rather than creating duplicate exposure. The panic sleeve only trades after severe market drawdowns and functions as an episodic crisis reversion strategy with minimal drag in normal environments. The volatility contraction sleeve activates during calmer regimes where pair spreads revert steadily. The volatility expansion sleeve captures persistent dislocations during turbulent periods. And finally the always-on sleeve acts as the structural convergence engine. Together these four sleeves form the portfolio’s core diversification structure.
With the DPMR and MR sleeves, adding monotonic momentum and event driven gap reversion further improves drawdown and return stability without materially increasing redundancy. The final result is an 8 sleeve portfolio with nearly double the Sharpe of the best standalone signal.
Conditioning matters mostly for implementation
One of the important findings from the project is that conditioning filters improve implementation quality more than raw alpha generation.
For most of the signal families, conditioning sharply reduces turnover while simultaneously improving post cost Sharpe. The active return MR sleeve illustrates the effect most clearly. Its turnover fell from 11.7% to 1.8% after trend scaling and residual dispersion gating and the net Sharpe rose from 0.557 to 1.279.
Similar reductions appear in residual MR, sector-relative, and gap reversion sleeves. In practice, conditioning acts as both a signal quality filter and an implementation control mechanism by avoiding trades during noisy or low alpha regimes.
Distance-pairs behaves a little differently. Conditioning produces almost no improvement because the partner matching mechanism already implicitly conditions on the stability of the peer relationship. The raw relative value convergence signal is already strong on its own. However, the unconstrained always-on DPMR sleeve becomes the dominant execution bottleneck in the portfolio. Its high turnover creates continuous pair spread trading activity across all market regimes making it especially sensitive to slippage, crowding, and spread compression as capital scales.
Still the diversified portfolio behaves much more robustly than the individual sleeves. At the baseline 10 bps costs assumption, the portfolio retains a 2.089 net Sharpe despite roughly 20% cost drag. Even at 25 bps, the portfolio still maintains a 1.304 Sharpe despite several individual sleeves becoming marginal or unprofitable.
The portfolio fails when expected
The out-of-sample period ends up being one of the more interesting parts of the project. Post 2024 (period after the dashed line) returns flatten, rolling Sharpe compresses, and drawdowns increase. Yet the portfolio remains profitable with the equity curve continuing upward. The behavior suggests regime sensitivity rather than obvious overfitting to the in-sample period.
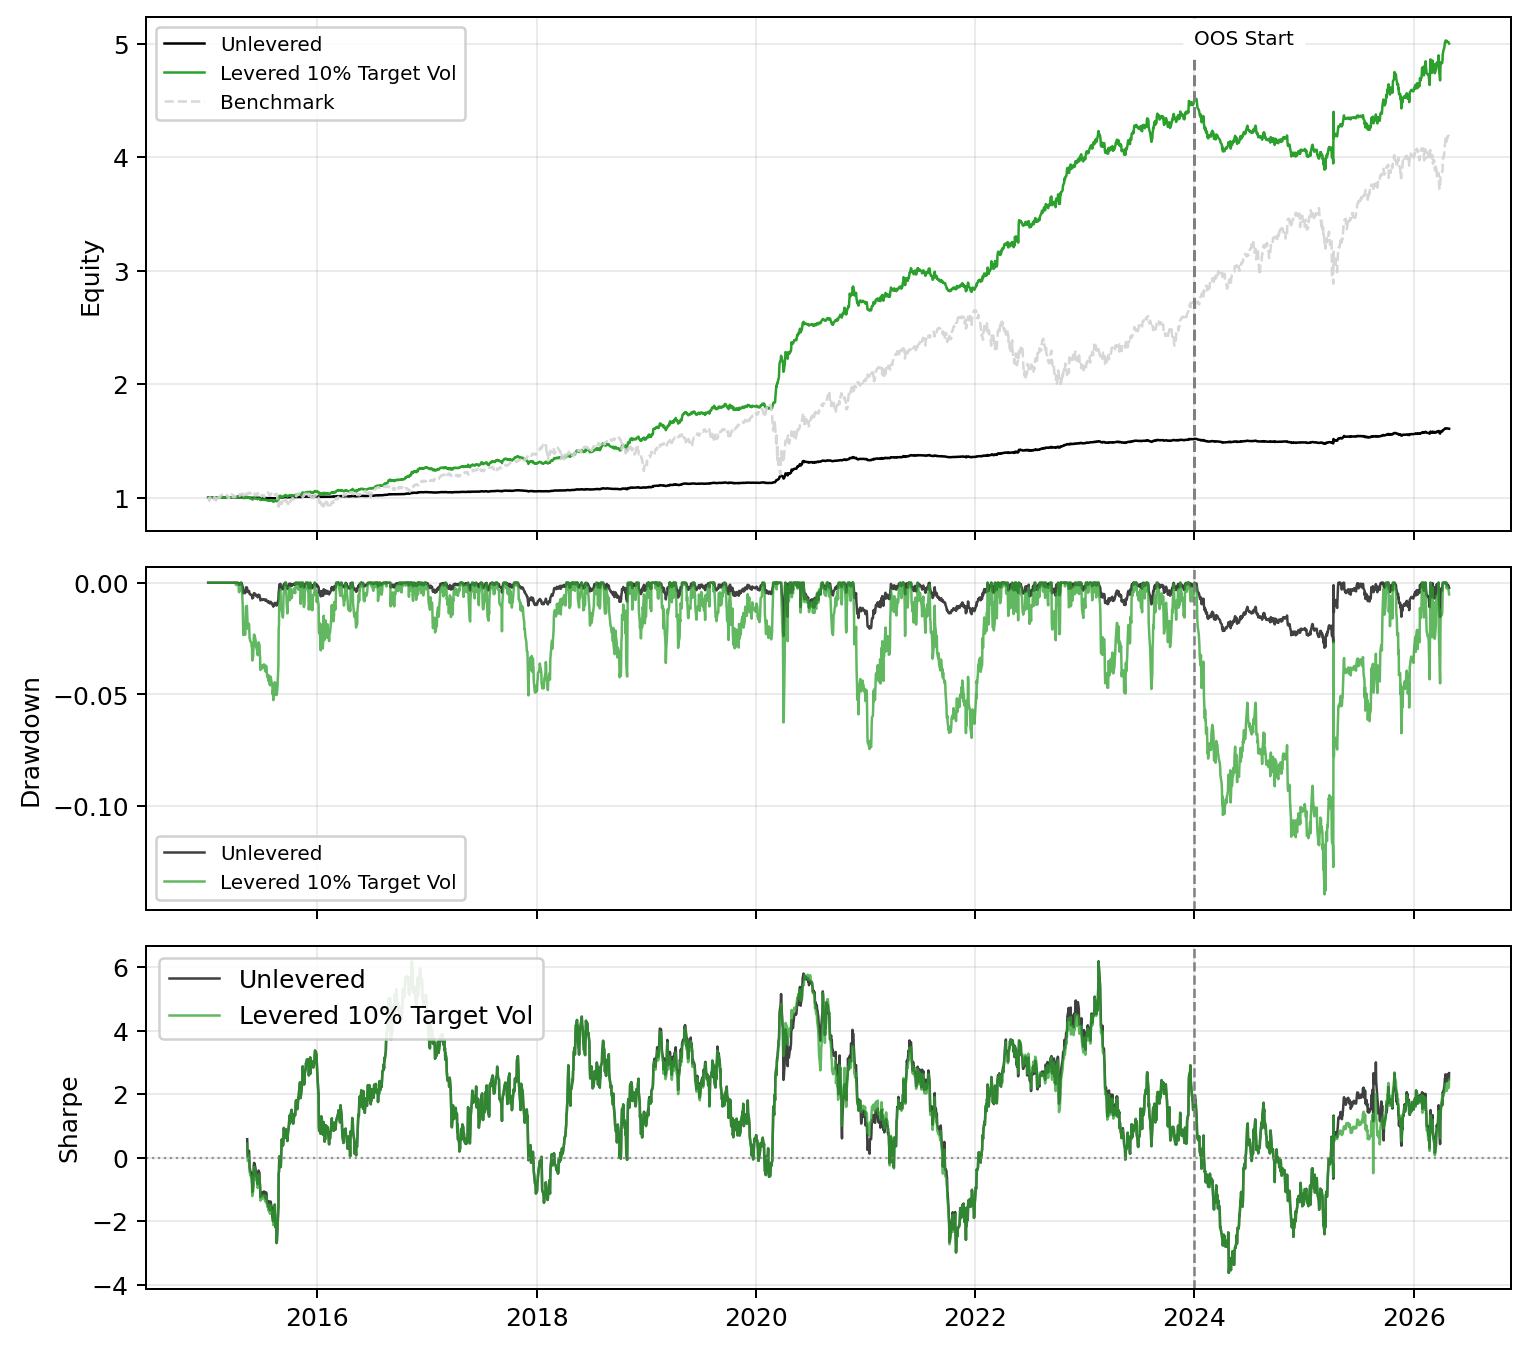
2024 is the only negative year. The market environment was dominated by strong index trends and concentrated mega cap leadership, reducing cross sectional reversal opportunities. A portfolio built primarily on short-horizon mean reversion, statistical arbitrage, and relative value convergence should be expected to struggle in exactly this regime.
Importantly, the portfolio recovers afterward rather than continuing to decay. It turns positive again in 2025 and strengthens further in the early part of 2026. This drawdown recovery pattern supports the interpretation that the weakness is regime driven rather than a structural failure. Rolling Sharpe dynamics also remain stable under leverage which also suggests that the conditioning and diversification structure continue functioning out-of-sample.
The strongest years are 2020 and 2022. During these periods cross sectional opportunity expanded as stocks moved more independently. In these environments, the crisis conditioned DPMR and event sleeves activate more frequently while several volatility gated sleeves engaged during vol expansion.
Summary
The final portfolio’s strength comes less from maximizing any individual signal’s Sharpe and more from combining economically distinct alpha engines with low realized correlation. The distance-pairs relative value signals form the portfolio’s core while conditioned mean reversion, momentum, and event driven reversion contribute complementary return streams across different market environments.
The out-of-sample results show regime sensitivity, particularly during the momentum dominated environment of 2024, but the diversification structure remains intact and performance recovers afterward. Overall, the project suggests that stable portfolio construction matters more than standalone signal optimization in cross-sectional statistical arbitrage.
The full report is here and the code for producing the results is here.
Resources
Signals and portfolio construction methodology informed by:
- Chan, Ernest P. Quantitative Trading: How to Build Your Own Algorithmic Trading Business. John Wiley & Sons, 2009. ISBN: 978-0-470-28488-9.
- Chan, Ernest P. Algorithmic Trading: Winning Strategies and Their Rationale. Wiley, Wiley Trading series, 2013. ISBN: 978-1-118-46014-6.